Smarter Reporting with the MoST5 Report Builder
MoST5’s built-in Report Builder gives you powerful, flexible reporting at your fingertips
The MoST5 Report Builder lets you create customised reports based on the data that matters most to you — whether that’s user activity, event registrations, CRM engagement, product sales, or membership stats. You can choose which fields to include, apply filters, and group data as needed
Save & reuse reports on your dashboard
Once you’ve built a report, you don’t need to start from scratch next time. Save your most-used reports to your personal dashboard so they’re always just a click away — perfect for monthly board meetings, committee updates, or compliance check-ins.
Copy & Paste or Export
You can simply copy, with the click of a button, the results of a report - including graphs - to your clipboard and paste into an application of your choosing, such as Word, Email, etc. Or export the data as an Excel file so you can crunch numbers or feed it into other systems.
Updated Data Snapshots
Your saved reports pull from a daily snapshot of the latest data in your system, so your insights reflect a 24-hour period. This lets you easily compare differences from one day to the next. Need to analyse user queries over the past month? Easy.
But wait, there’s more…
It may not matter to everyone, but it allows you to create datasets that record metrics every 24 hours based off your criteria. You can then include one or more datasets into a report, for example user engagement and membership activity.
The reports can then be generated over a user-defined period producing graphs and AI assisted analysis. At the click of a button the report can then be copied into your clipboard and pasted into another application such as email, Word, etc. There is also an option to export the data used for the report so it can be used in any other way you choose.
Here’s an example:
|
Activity Report
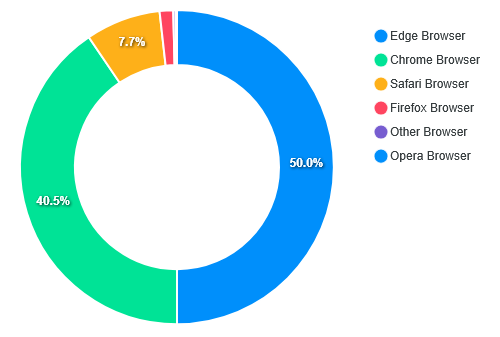
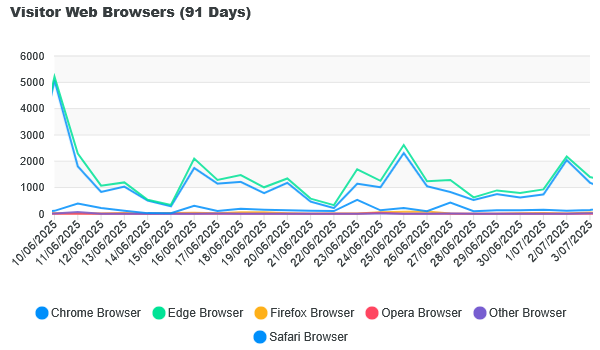
This dataset covers the website traffic from May 22, 2025, to August 21, 2025, focusing on client activity across various web browsers.
Key Observations and Activity Trends
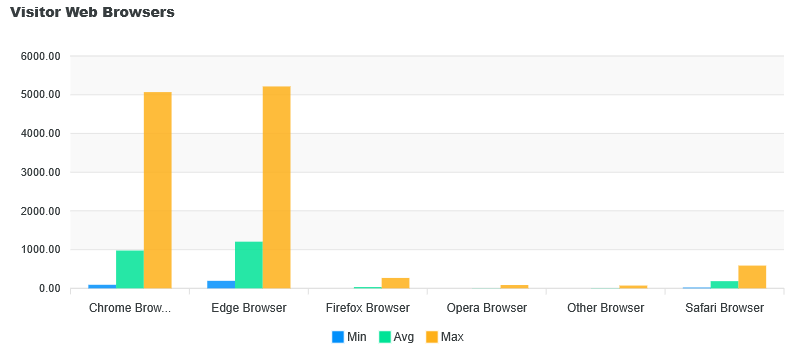
The dataset indicates fluctuating traffic levels across different browsers, with notable peaks and troughs in client activity. Chrome and Edge browsers dominate the usage statistics, while Opera and Firefox show significantly lower engagement.
Total Activity by Browser
|
Browser
|
Total Activity
|
|
Chrome Browser
|
58063
|
|
Edge Browser
|
68894
|
|
Firefox Browser
|
1010
|
|
Opera Browser
|
112
|
|
Other Browser
|
154
|
|
Safari Browser
|
5783
|
|
|
|
Notable Patterns and Anomalies
The dataset shows a significant spike in activity on June 10, 2025, with 5068 Chrome users and 5214 Edge users. This may indicate a promotional event or a significant website update that attracted more visitors.
Dates with No Activity or Zero Counts
- No dates with zero activity were recorded during this period.
|
Whether you're running a membership organisation, managing a club, or tracking e-commerce performance, MoST5’s Report Builder gives you the visibility and control to make informed decisions.